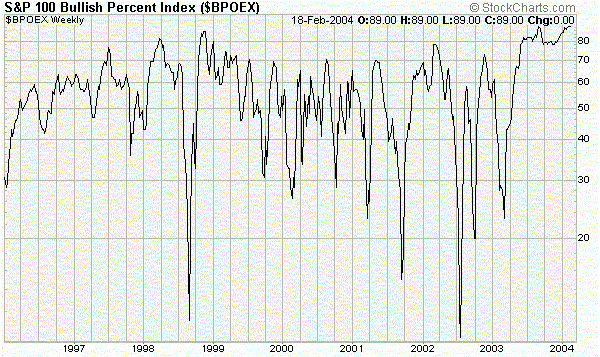
Chart of the Day: OEX Walking the Plank
Blogging has been light to day as I put the finishing touches on the March dead tree issue of Strategic Investment. I'll be modest and say I think it's a good one. We live at the confluence of some major financial and historical trends, which makes investing pretty difficult. But if we're at the junction of several "super cycles" (i.e. debt), as least we have "Boyd Cycles" working for us. That is, most wave theories (Kondratiev and Elliott are two) are great for identifying where you are in the big picture. They are truly "strategic" views of the economy and the market. Tactically--in the place where you have to make investment decisions every day with your money--they're less useful telling what to buy and sell and when to do it. That's where Boyd Cycle's come in. Boyd's OODA loop (observe, orient, decide, and act) helps you every single time you make an investment decision. It's a way of making decisions--not just a way of understanding the market. (For more on Boyd Cycles check out this post from last week. S&P 100 Historically Overbought On to today's chart...courtesy of the good folks at www.stockcharts.com. It's an excellent time with some great tools. The chart below is a measure of breadth. Specifically, it tells you what percentage of stocks on the S&P 500 have bullish point and figure charting formations. I'm not an expert on point and figure charting--although my friends Lynn Carpenter and Katie Kropkowski use it frequently. But what the OEX Bullish Percentage chart tells us is how many stocks on the S&P 100 are in bullish patterns. I pick the OEX, as you'll recall, because it's the highest concentration of tech and financial stocks of the major indexes, with over 27 tech and financials making up over 40% of OEX's $2.7 trillion market cap. You'll notice that any time the bullish % on OEX goes over 70, a correction ensues, whereas 30 looks like the level where it gets oversold. Right now, it's executing a walking-the-plank formation. Actually, there's no such technical term I know of. But it does convey my point: the OEX is overbought and trading on borrowed time. Update: Notice too, that the lows keep getting lower, until early 2003, right before the current rally. Since then, even after being overbought, the corrections have been less severe. OR, the next big correction may make a new multi-year low. Walking the Plank Formation


0 Comments:
Post a Comment
<< Home