Chart of the Day: More Bad Breadth
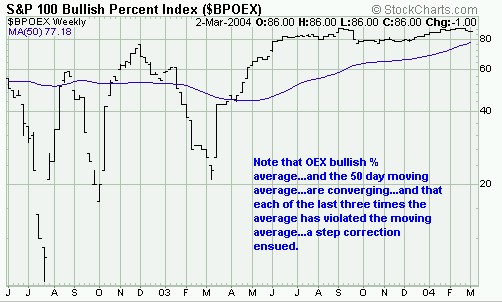
Working on an update of my "Five Signs of Financial Reckoning Day" for the weekly e-mail. Should be out later today or early tomorrow. For now, I've updated the OEX bullish % chart I mentioned in the March issue. The chart is a measure of breadth on the S&P 100, specifically, how many OEX stocks are in bullish point and figure patterns. As you can see from the chart, it's still "walking the plank." You can also see the average is close to converging with the 50-day moving average. And you can also see that, in the past, that hasn't been good for the index average. And since the OEX contains some of the biggest stocks in America (especially financials and techs) it may be a clue about the kind of correction that's in the cards.
posted by Daniel @ 3/03/2004 03:24:00 PM
0 comments
![]()

0 Comments:
Post a Comment
<< Home