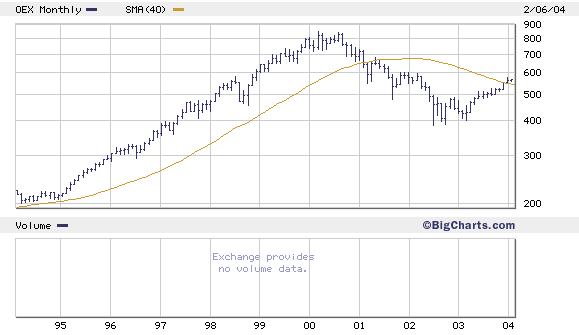
S&P 100: Chart of the Day
More comments on the S&P 100 in the forthcoming weekly e-mail. But in the meantime, here's the chart. It shows the S&P 100 in log scale, ten years back, monthly closes, with a 40-month moving average. Mega-long term moving average, you could say. If you use the 50% retracement rule for looking at this chart, the S&P 100 has recoverd half its bear market loss. But does it have the momentum to go higer from here? That is, from its bull market high of 832 on March 24, 2000 to its bear market low (thus far) of 392 on October 9, 2002, OEX fell a total of 440 points. Half of that total (50%) is 220. Add 220 to 392 and a 50% retracement of the total bear market loss would be...612. On Jan. 26, the OEX reached 573 before losing some steam. The last time it traded above 612...was in early August of 2001, when it closed at 618. Almost all the indexes made multi-year highs on the 26th...and a few days later the Fed crashed the party. The 26th may mark the beginning of the second leg down in this secular bear market.


0 Comments:
Post a Comment
<< Home