Chart of the Day: Getting Out at the Top?
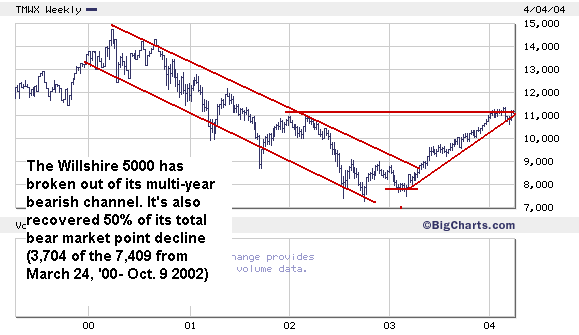
Will the bullish jobs report be seen as the END of the bull market rally and the resumption of the bear market? The chart bellow says "yes." It's a five-year chart of the Wilshire 5000 Total Market Index (TMWX). From its high of 14,751 to its low of 7,342, the index lost 50% and 7,409 points. Since making that low in October of 2002, it's recovered half its bear market loss (in terms of points.) In fact, at Friday's close of 11,202, it's trading slightly above the 50% recovery of 11,046. Technically, this doesn't mean TMWX has to correct. But when the broadest measure of stock market wealth has tacked on 52%...we're either in a new bull market...or this rally has about run its course. Obviously, you know where I stand on that issue, which is why I've sold a good number of our positions to lock in profits. It could be that the frothiness of the market means another 5-10% rise in the market. But I'd rather make my exit now than try to time in perfectly. TWMX Sends a Sell Signal tmwxfiveyearweekly.bmp P.S. A full 60% retracement of the bear-market decline would take TMWX up to 11,747--a level it last reached, but could not hold in June 2001.
posted by Daniel @ 4/05/2004 02:46:00 PM
0 comments
![]()

0 Comments:
Post a Comment
<< Home