Gold at $416
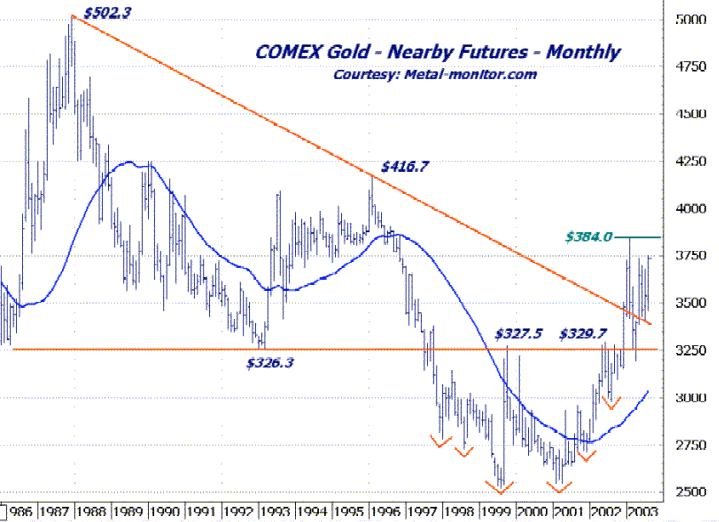
I am not a technician when it comes to gold. My reasons for recommending it and owning are many and varied, but mainly a deep and abiding suspicion of Central Banks and paper backed by nothing. I think Bill Bonner is right that taking the U.S. off the gold standard was indeed, "Nixon's" sin. But some of my best friends are technicians. They don't share my passion for discussing monetary policy. But even THEY believe gold is reaching some important technical milestones. The best of my tehnician friends is Greg Weldon (http://ww.metal-monitor.com), although to be fair to Greg, he also has a unique command of the macro economic factors that act on the stock market his well. He's just one of those guys that happens to be good at everything he turns his attention to. And lucky for me, his attention is usually focused on the same financial themes mine is focused on. Like gold. Take a look at the chart below.
 This chart is a long-term chart of gold futures. In his daily Metal Monitor commentary, Greg says, "Of specific, bullish, long-term technical interest, as plotted in the monthly gold chart above, we note:
*Confirmed upside violation of downtrend line in place since 1987
*Massive inverted head-and-shoulders bottoming pattern
*Mega-long-term 36-month Moving Average trending higher
*Moving average at highest level since 1999
"Can anyone say gold at $416? How about $502?"
Three other important things to watch in the gold price, according to Greg. First, if gold closes today above the weekly close of $369.90, it would represent a new bull move WEEKLY closing high. Second, If gold closes August above the monthly close of $368.30 (set in Jan. 03) it would represent a new bull move MONTHLY closing high. And finally, if gold violates the bull move intra-day, intra-week, intra-month high of $384, it would represent a new bull move MULTI-YEAR high.
Notice a pattern here?
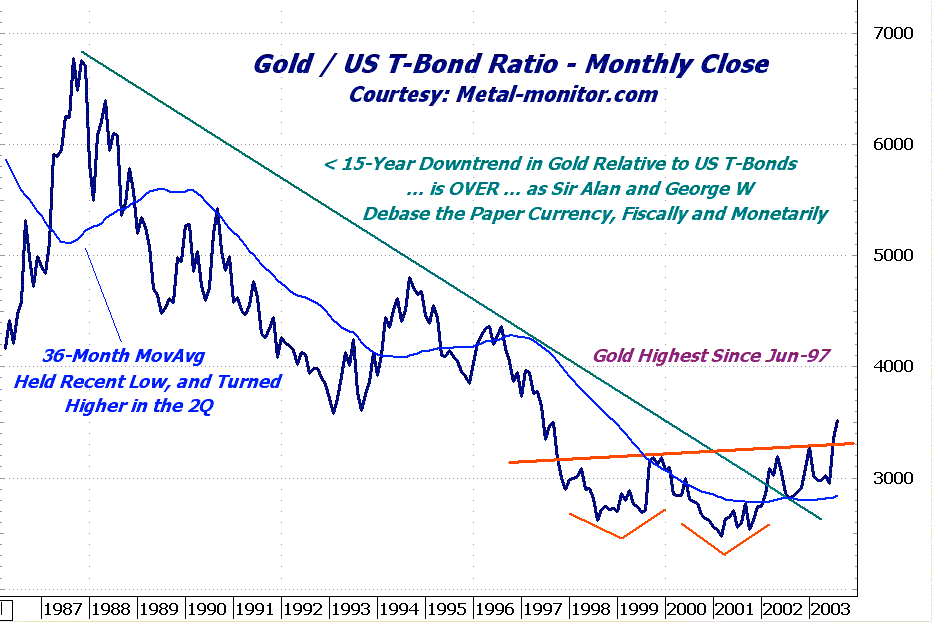
And then there's the gold/U.S. T-Bond Ratio. Yesterday I speculated that the big move in uh-hedged gold stocks on the HUI, coupled with the undersubcribed 2-year treasury auction, suggested that dollar disinvestment has begun. If you want a picture that explains it lot more succinctly, look at this...


0 Comments:
Post a Comment
<< Home