Housing Booms
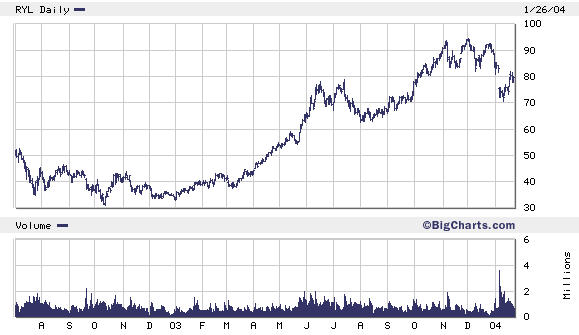
Well, it looks like I got totally wrong on housing....or did I? First the numbers. The Census Bureau reported that in 2003, housing starts increased 8.4% over 2002. This marks a 25-year high of 1.85 million. The record was set in 1972 with 2.36 million. This, on the face of it, is confirmation that the housing boom is alive and well, right? According to the Mortgage Bankers Association of America, the 30-year fixed mortgage rate is 5.56%, still historically low. We have to very bullish positive numbers. Both at "historical" levels. The question I've been asking all along is, "How long can something stay historically high or low before it goes back to historically average?" The answer, apparently, is, "Much longer than you think." I won't belabor this point much since I've written about it a lot this week. But just one simple reiteration: housing activity is a function of affordability. As home prices rise, homes become less affordable to marginally qualified buyers entering into the market for the first time with generous borrowing terms. The other pressure on affordability is stagnant or declining consumer incomes...and higher unemployment. The housing market today reminds me of the tech market in '99. If you raised even a hint of a doubt, you were laughed out of the room, humored, or patted on the head sympathetically, like a wayward child. No one can imagine that what we're really seeing is the hyperbolic phase of a credit-induced bubble in the American housing market, and that it's going to have disastrous consequences for nearly everyone involved. Instead, the capacity build out goes on...under the assumption that the supply/demand dynamic in housing will support ever higher home prices and new home starts....rates after all, are going to stay low for a long time..... As you'd expect, homebuilding stocks did well yesterday. But take a look at their charts and tell me you if you think, on the back of the strongest housing starts in 25-years, any of these stocks are about to make new highs. First, Ryland Homes (RYL). Here's a two-year chart with a 200-day moving average. Ryalnd was up 6.6% yesterday to close at $79.43. It's still well below its 52-week high of $94.30
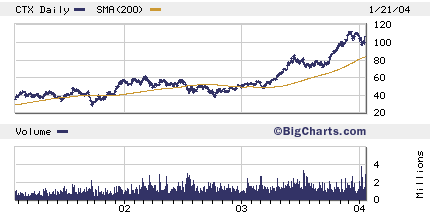
 Then there's Centex (CTX). Centex was up 6.75% yesterday to close at $106.53. Its 52-week high is $113.08.
 And finally, Beazer Homes (BZH). BZH was up 4.78% to close at $96.40--well off its 52-week high of $109.60.
 This is EXACTLY the time to be short the home-builders...as they enjoy one more giddy bullish run on the back of a building boom that can only last at lower interest rates.
AND, what didn't make a lot of news yesterday is a regulatory move that may limit the ability of the GSEs to expand their balance sheets. In layman's terms, the GSEs current regulator suggested putting a cap on the size of Freddie Mac's mortgage portfolio and requiring to hold more real capital. This would effectively limit the amount of mortgages FRE could buy or back on the open market. It would slow down the easy money freight train, at least until Freddie Mac comes clean and shows the public its books...something it hasn't done since last year, and doesn't plan on doing until late this year...
From CBS.Marketwatch...
Regulator mulls limits on Freddie Mac's portfolio (FRE) By Matt Andrejczak
WASHINGTON (CBS.MW) -- Freddie Mac (FRE) may be required to restrict the growth of its mortgage portfolio and hold more regulatory capital until it produces consistent financial results, its regulator testified to a House panel. Armando Falcon, director of the Office of Federal Housing Enterprise Oversight, said his agency could make its decision by the end of next week. Freddie Mac, a big player on the secondary mortgage market, is not expected to produce regular quarterly financial statements until late this year. The possible requirement stems from Freddie Mac's $5 billion earnings restatement last year. It is part of 16 recommendations that OFHEO's staff made to Falcon in a 185-report released last month.

0 Comments:
Post a Comment
<< Home