Fed Funds and the Financial Economy: Chart of the Day
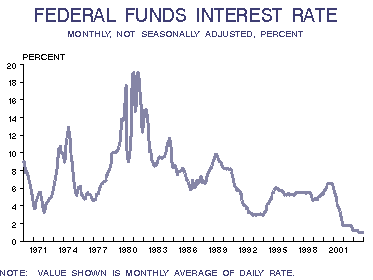
The chart below is a nice compliment to the chart earlier this week showing the S&P's growth since the end of '73-'74 bear market. Notice that once the U.S. was off the gold standard, the Fed began lowering the funds rate right away. Only after hyper-inflation and the Arab oil embargo did they hike rates back up. About the time the Great Bull Market got under way, the funds rate began a steady overall decline to today's historically low levels. And so there you have it...the correlation between cheap money and rising stock prices, the "financialization" of the American economy, courtesy of your un-elected central bankers and the politicians who slobber at their feet. UPDATE: one further comment on this chart. Note that the rate cutting since 2000 has failed to produce the same kind of zip in stock prices you're accustomed to seeing after previous eases. Why would that be? One reason is that the real beneficiaries of lower rates today are the GSEs, Fannie Mae and Freddie Mac. The new money isn't finding its way into stock prices. It's finding its way into housing...and the huge bond issues of the last five years from the GSEs. This is an even more acute "financialization." When you buy a stock, you're buying the present discounted value of future earnings. Those earnings may be more or less than what you're expecting. But unless you're buying a real dog of a business, or one with lying accountants, you're always buying real earnings. Not so with the mortgage-bond market. Buying mortgage bonds is buying some else's promise to pay....Namely a homeowner. Buyers of FRE and FNM bonds are banking on American homeowners making their mortgage payments.


0 Comments:
Post a Comment
<< Home