Heart Attack: Part III
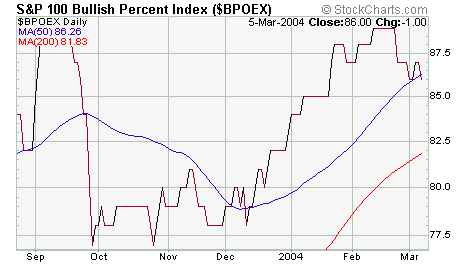
The chart below shoes the S&P Bullish Percentage Index making an interesting technical move. The index is crossing below its 50-day moving average. That average, however, is still moving directionally upwards...and the index is trading well above its 200-day moving average. Still, this suggests to me that the Index is having trouble staying overbought. After all, the only way for it to stay overbought is if investors keep buying S&P 100 stocks. And with last week's labor market news but one example of the less than glamorous economic back story, it's easy to see how the OEX could go from overbought to oversold rather quickly. Tick tick tick. chespains.bmp
posted by Daniel @ 3/08/2004 04:45:00 PM
0 comments
![]()

0 Comments:
Post a Comment
<< Home