The Remorse Price of Gold and the BED Spread
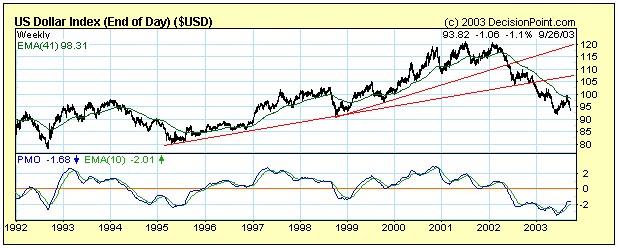
Tomorrow will be the weekly round up for SI subscribers. I got a bucket full of e-mail questions that I’ll try to address, including questions about gold, ETFs, shorting the dollar, and Japanese bonds. Today, I want to introduce you to some new ways to measure macro risk. Remember, tomorrow we’ll look at the micro. But today, how can we figure out just how close we are to end of the world as we know it? Last week I tossed around some awfully big ideas like they were throw pillows on a living room couch. But the heart of everything I tried to point out to you is the same: we live in interesting times. Of course, all men and women, at all stages of history, must have thought they too, were living in the interesting times. How couldn’t you? How couldn’t you think that you were living at a crucial period in the evolution of the world, and that somehow the events of your days would be definitive to the future of the world? You could be modest, I suppose. You could confine your ambitions on God’s creation to living a good life, regardless of the course of history or the price of spot gold. But let’s be ambitious and make the conclusion that today’s events ARE definitive, at least to YOUR future. And especially your financial future. It’s not just self-important ambition that allows you to conclude that today’s financial world is at a crossroads. It’s a series of serious structural imbalances that are putting enough pressure on the dollar standard to snap it like a femur. It takes a lot of pressure to snap a femur (the equivalent of seventy 154 lb wrestlers, or 5.4 tons, which is about the weight on an industrial air conditioning unit) In fact, it probably takes more pressure to snap a femur than it does to snap the dollar standard. The dollar standard, after all, is a creation of men. And in evolutionary terms, it’s a thirty-year-old stripling, hardly a glint in the eye of Charles Darwin. The femur, by contrast, is thousands of years old, and represents nature’s patient work with the tried and true. It can stand on it’s own two legs. The dollar, is supported only by the full faith and credit of the United States. And in these interesting times, that is a slender reed to lean on. Measuring Risk On Friday, I made the case to you that the financial economy created by the dollar standard and debt has become far too large and unstable. It’s changed the incentives, and therefore the behavior, of investors, governments, central banks, and bulk food buyers at Sam’s Club. It’s created a world dependent on American consumption, financed by debt and the foreign savings. “But how do you really measure that risk on a day-to-day basis,” you might be asking? Sure, it’s okay to say that gold probably represents the most durable store of value when paper currencies go up in flames. But how do you know on any given day whether gold is too expensive, or when bonds are a better investment than stocks? Or how do you know if we’re in a two-year bullish correction rather than a two-month one? I should say that if I’m right about gold and the dollar, it won’t really matter at what price you buy gold or gold stocks--if you buy them before the big “correction” in the dollar. There MAY be rallies in stocks and the dollar. And you should hedge that risk buy taking some counter-intuitive positions (like the XAU puts I recommend in the October issue). But the trade of the decade is still simple: sell the dollar, buy gold. The Dollar Taketh Away...
 ...And Gold Giveth
 In the spirit of introducing a meaningful (and somewhat playful) measurement about the end of the financial economy and the beginning of whatever’s next, I’m introducing two new terms to your vocabulary.
***The Remorse Price of Gold
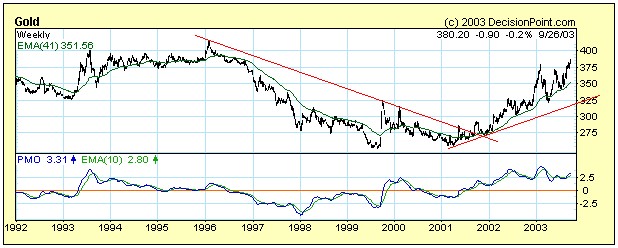
Gold, as measured by the XAU, fell 6% last week. Spot gold fell to $381.80 on Friday after hitting a seven-year high of $394.80 the day before. But neither of these prices tell you what you need to know about gold.
What you need to know about gold is how far it is above the price at which you SHOULD have most recently bought it. I call this “The Remorse Price of Gold,” implying, as you can guess, that you should be sorry you didn’t buy it the lower price earlier when you had the chance.
The remorse price will change, the higher gold goes. Each level it passes will be the one at which you should have bought it, but waited instead to see if it was the top.
For instance, the benchmark remorse price for gold right now, is $350. Once it got above $350, everyone knew gold was surely going to $400. But until it broke $350 and went higher, $350 appeared to be the ceiling. Not anymore. Now, it’s the benchmark remorse price.
That means at Friday’s close, gold was selling at 9% above its benchmark remorse price. Just one day before, when it neared its 7-year high, gold was selling at nearly 13% premium to its remorse price. Bearish technical traders like to say that gold formed a double top at $375. But if you buy my thesis that the end of the dollar standard is gold bullish, buying gold when it’s a mere 7% above its remorse price is a steal.
The Remorse Price Premium in Gold Stocks
Another way of looking at gold is to compare gold bullion to gold stocks. While spot gold racked up a 12% increase from August 5th to September 25th (from $348 to $390.70), the XAU rose 20%, from 80.91 to 97.50.
This is what you might expect, of course. There’s a higher premium to remorse price on gold stocks than on spot gold. This can work to your advantage as an investor, IF you don’t wait until the premium is too large.
And of course the entire metric is based on the idea that both spot gold and gold stocks will go higher as the deleveraging of the stock market (and the American economy) proceed. If you don’t believe in the underlying investment analysis--that the financial economy is overextended and the dollar is due to decline--you won’t feel any remorse for not buying gold.
But from now on, when tracking the movement of gold prices, I’m going to include the remorse price. It’s a simple way for you to see ongoing battle between the financial economy and the real economy.
I’ll be expanding on this idea in the near future too, in a little more serious way. What I’ve been compiling is a study of sector indexes that measure the “financial economy” created by Greenspan and sectors that are more reflective of the “real economy,” without the influence of massive financial leverage.
I’ll let you know how it goes. When I’m done, it will give you a daily indication of how advanced the deleveraging of the stock market is. And specifically, it will give you a ready-made playbook for buying puts on the big financial losers and calls on the “real,” non-financial winners.
***The BED Spread
Looking at the battle between gold stocks and financial stocks in the market is one way of finding out what investor sentiment is. But the real heart of the issue is confidence in the U.S. government and its dollar.
How can you measure the credit risk of the U.S. government? The conventional way to measure general systemic risk in the Treasury market is known as the TED spread. It’s the market’s measure of how close we are to another financial meltdown. If youw ant a technical explanation, keep reading. If not, skip to the next section.
Technically speaking, the TED spread is the difference between interest on the 90-day U.S. Treasury and the 90-day eurodollar deposit contract. Eurodollars are dollar-denominated deposits held by commercial banks outside the United States and in Europe. All things being equal, when they are packaged up and sold like U.S. bonds, the issuer must pay a slightly higher interest rate than the 90-day T-bill.
The issuer pays the higher interest rate because the U.S. government collects its revenues at the barrel of a gun, and commercial banks do not. This, presumably, makes the U.S. government a “safer” credit risk e.g. less likely to default. And so the Feds don’t have to pay as a high an interest rate to attract buyers.
Incidentally, because Fannie Mae and Freddie Mac enjoy the implied guarantee of the U.S. government, they are also able to issue debt at lower interest rates. But as I pointed out last week, the U.S. government is not legally obligated to back up Fannie and Freddie. And strictly speaking, the U.S. government, like all governments before it, can simply choose to not fulfill its obligations.
The TED spread is a measure of systemic risk. But it’s premised on the U.S. bond market being the safe-haven of last resort. What we want to measure is how close the U.S. government is to its Day of Reckoning. What we need to measure is the spread between U.S. debt (which WE know to be risky) and debt that the market considers risky, namely baseline emerging market debt (BED).
We need to know the BED spread.
***Calculating the BED Spread
To know how close the U.S. government is to going bankrupt, we simply establish a spread between emerging market debt and U.S. government debt. And then we watch it converge. U.S. government yields rise as the dollar falls. And emerging market debt yields fall, as it becomes comparatively less risky than dollar denominated-debt.
Granted, Long Term Capital Management went bust playing a spread convergence trade. But their mistake was thinking that Russian yields would come down. They didn’t. Russia defaulted and yields went sky high, which is something that I expect to eventually happen in the U.S. And I’m not nearly as smart as Myron Scholes. My model is based on a simple observation that the U.S. government is a growing credit risk. The only real challenge of the BED spread is to measure it.
You COULD measure it by comparing the ten-year Treasury note with say, an equivalent Argentine or Russian government note. But I prefer to take a broader measure of emerging market debt versus U.S. government debt. We’ll use two closed-end bond funds, GVT and EMD.
Treasuries Safe...Emerging Debt Volatile...For now
In the spirit of introducing a meaningful (and somewhat playful) measurement about the end of the financial economy and the beginning of whatever’s next, I’m introducing two new terms to your vocabulary.
***The Remorse Price of Gold
Gold, as measured by the XAU, fell 6% last week. Spot gold fell to $381.80 on Friday after hitting a seven-year high of $394.80 the day before. But neither of these prices tell you what you need to know about gold.
What you need to know about gold is how far it is above the price at which you SHOULD have most recently bought it. I call this “The Remorse Price of Gold,” implying, as you can guess, that you should be sorry you didn’t buy it the lower price earlier when you had the chance.
The remorse price will change, the higher gold goes. Each level it passes will be the one at which you should have bought it, but waited instead to see if it was the top.
For instance, the benchmark remorse price for gold right now, is $350. Once it got above $350, everyone knew gold was surely going to $400. But until it broke $350 and went higher, $350 appeared to be the ceiling. Not anymore. Now, it’s the benchmark remorse price.
That means at Friday’s close, gold was selling at 9% above its benchmark remorse price. Just one day before, when it neared its 7-year high, gold was selling at nearly 13% premium to its remorse price. Bearish technical traders like to say that gold formed a double top at $375. But if you buy my thesis that the end of the dollar standard is gold bullish, buying gold when it’s a mere 7% above its remorse price is a steal.
The Remorse Price Premium in Gold Stocks
Another way of looking at gold is to compare gold bullion to gold stocks. While spot gold racked up a 12% increase from August 5th to September 25th (from $348 to $390.70), the XAU rose 20%, from 80.91 to 97.50.
This is what you might expect, of course. There’s a higher premium to remorse price on gold stocks than on spot gold. This can work to your advantage as an investor, IF you don’t wait until the premium is too large.
And of course the entire metric is based on the idea that both spot gold and gold stocks will go higher as the deleveraging of the stock market (and the American economy) proceed. If you don’t believe in the underlying investment analysis--that the financial economy is overextended and the dollar is due to decline--you won’t feel any remorse for not buying gold.
But from now on, when tracking the movement of gold prices, I’m going to include the remorse price. It’s a simple way for you to see ongoing battle between the financial economy and the real economy.
I’ll be expanding on this idea in the near future too, in a little more serious way. What I’ve been compiling is a study of sector indexes that measure the “financial economy” created by Greenspan and sectors that are more reflective of the “real economy,” without the influence of massive financial leverage.
I’ll let you know how it goes. When I’m done, it will give you a daily indication of how advanced the deleveraging of the stock market is. And specifically, it will give you a ready-made playbook for buying puts on the big financial losers and calls on the “real,” non-financial winners.
***The BED Spread
Looking at the battle between gold stocks and financial stocks in the market is one way of finding out what investor sentiment is. But the real heart of the issue is confidence in the U.S. government and its dollar.
How can you measure the credit risk of the U.S. government? The conventional way to measure general systemic risk in the Treasury market is known as the TED spread. It’s the market’s measure of how close we are to another financial meltdown. If youw ant a technical explanation, keep reading. If not, skip to the next section.
Technically speaking, the TED spread is the difference between interest on the 90-day U.S. Treasury and the 90-day eurodollar deposit contract. Eurodollars are dollar-denominated deposits held by commercial banks outside the United States and in Europe. All things being equal, when they are packaged up and sold like U.S. bonds, the issuer must pay a slightly higher interest rate than the 90-day T-bill.
The issuer pays the higher interest rate because the U.S. government collects its revenues at the barrel of a gun, and commercial banks do not. This, presumably, makes the U.S. government a “safer” credit risk e.g. less likely to default. And so the Feds don’t have to pay as a high an interest rate to attract buyers.
Incidentally, because Fannie Mae and Freddie Mac enjoy the implied guarantee of the U.S. government, they are also able to issue debt at lower interest rates. But as I pointed out last week, the U.S. government is not legally obligated to back up Fannie and Freddie. And strictly speaking, the U.S. government, like all governments before it, can simply choose to not fulfill its obligations.
The TED spread is a measure of systemic risk. But it’s premised on the U.S. bond market being the safe-haven of last resort. What we want to measure is how close the U.S. government is to its Day of Reckoning. What we need to measure is the spread between U.S. debt (which WE know to be risky) and debt that the market considers risky, namely baseline emerging market debt (BED).
We need to know the BED spread.
***Calculating the BED Spread
To know how close the U.S. government is to going bankrupt, we simply establish a spread between emerging market debt and U.S. government debt. And then we watch it converge. U.S. government yields rise as the dollar falls. And emerging market debt yields fall, as it becomes comparatively less risky than dollar denominated-debt.
Granted, Long Term Capital Management went bust playing a spread convergence trade. But their mistake was thinking that Russian yields would come down. They didn’t. Russia defaulted and yields went sky high, which is something that I expect to eventually happen in the U.S. And I’m not nearly as smart as Myron Scholes. My model is based on a simple observation that the U.S. government is a growing credit risk. The only real challenge of the BED spread is to measure it.
You COULD measure it by comparing the ten-year Treasury note with say, an equivalent Argentine or Russian government note. But I prefer to take a broader measure of emerging market debt versus U.S. government debt. We’ll use two closed-end bond funds, GVT and EMD.
Treasuries Safe...Emerging Debt Volatile...For now
 The chart above shows that the return on government debt is modest compared with emerging market debt. And each time you see the return on EMD fall back to the yield on U.S. debt, you can bet there was a major default or currency crisis somewhere.
GVT is the Morgan Stanley Government Income Trust. One hundred percent of the fund’s assets are dollar denominated. It currently yields 4.18%, which is higher than the latest yield on the 10-year note 4.04%. But GVT is an excellent proxy for the market’s general perception of the credit worthiness of the U.S. government. Here are its five holdings and allocations:
1. U.S. Treasuries 30.28%
2. Short term bonds 27.99%
3. Fannie Mae bonds 23.02%
4. Freddie Mac bonds 11.96%
5. Ginnie Mae bonds 6.75%
I may compare yields on actual government bonds later. But for now, we’ll use GVT to represent the average yield on high-grade (for the time being) government debt.
To represent emerging market debt, let’s use EMD, the Salomon Brothers Emerging Market bond index. Eighty eight percent of the funds holdings are sovereign debt. So we are basically comparing apples to apples, the bonds of emerging market governments versus Uncle Sam’s bonds. Here is how EMD’s holdings are allocated:
1. Brazil 23.57%
2. Mexico 20.87%
3. Russia 17.97%
4. Colombia 5.08%
5. Ecuador 5.05%
And the yield? EMD yields, as of today, 9.76%
So…after all that build up…what is the current BED spread? Right now, it’s an astonishing 5.21%. Why astonishing? Well…it suggests the market does NOT perceive a great deal of risk in U.S. government debt. If and when it does, the BED spread will tighten. And THAT is exactly what we’ll be watching for in the coming days and months.
Stay tuned to an elaboration of the BED spread metric. I’m hunting up some data on historic yields on closed-end funds. If you have a suggestion, feel free to e-mail me at strategicinsider@aol.com
***Flight From Vanity
Bt the way, as a follow up to last week’s post on how to short the dollar, or “sell” it, I should add that you can use the TED spread to your advantage. The TED spread widens when investors buy Treasuries and sell eurodollar deposits. Treasury buying drives Treasury yields down, while eurodollar selling forces eurodollar yields up. “Buying” the TED spread means playing a widening spread.
You sell the TED spread when you expect yields to tighten. For example, for the week ended September 26th, the discounted yield on the 90-day T-bill was .93. The discounted yield on 90-day eurodollars was 1.07…for a spread of 14 basis points.
From there, you’d compare that with historic spreads, and you’d also take a peak in the futures market and see what the difference is between the cash market and the futures market. If the futures market is acting efficiently, and it senses the spread is out of whack, prices on eurodollar futures will be different than prices on the cash indexes.
However, I don’t want to get too complicated. You COULD use the TED spread, but only when there’s a big divergence between the markets perception of dollars backed by the U.S. government and dollars backed by foreign commercial banks. Right now, the spread is modest. But there might come a day, and not far away, when a dollar backed by a foreign commercial bank is a much better risk than a dollar backed by the U.S. government.
The simple observation is that either on a futures index, you would but and sell eurodollar puts and calls. The last time I recommended it, I recommended euro dollar calls on the basis of what I believed would be lower U.S. interest rates. The futures market had priced in a rate hike, creating a discrepancy. The market was arguing for a wider TED spread. I was calling for a tighter spread.
As you can see, buying options on futures is a little trickier than a straight play on rising interest rates or falling bond prices. For both of those scenarios, go back and look at Friday’s post. And for tomorrow, I’ll pass on the names of a few, gulp, mutual funds, which are even simpler (though costlier) ways to play a rise in U.S. long-term rates.
The chart above shows that the return on government debt is modest compared with emerging market debt. And each time you see the return on EMD fall back to the yield on U.S. debt, you can bet there was a major default or currency crisis somewhere.
GVT is the Morgan Stanley Government Income Trust. One hundred percent of the fund’s assets are dollar denominated. It currently yields 4.18%, which is higher than the latest yield on the 10-year note 4.04%. But GVT is an excellent proxy for the market’s general perception of the credit worthiness of the U.S. government. Here are its five holdings and allocations:
1. U.S. Treasuries 30.28%
2. Short term bonds 27.99%
3. Fannie Mae bonds 23.02%
4. Freddie Mac bonds 11.96%
5. Ginnie Mae bonds 6.75%
I may compare yields on actual government bonds later. But for now, we’ll use GVT to represent the average yield on high-grade (for the time being) government debt.
To represent emerging market debt, let’s use EMD, the Salomon Brothers Emerging Market bond index. Eighty eight percent of the funds holdings are sovereign debt. So we are basically comparing apples to apples, the bonds of emerging market governments versus Uncle Sam’s bonds. Here is how EMD’s holdings are allocated:
1. Brazil 23.57%
2. Mexico 20.87%
3. Russia 17.97%
4. Colombia 5.08%
5. Ecuador 5.05%
And the yield? EMD yields, as of today, 9.76%
So…after all that build up…what is the current BED spread? Right now, it’s an astonishing 5.21%. Why astonishing? Well…it suggests the market does NOT perceive a great deal of risk in U.S. government debt. If and when it does, the BED spread will tighten. And THAT is exactly what we’ll be watching for in the coming days and months.
Stay tuned to an elaboration of the BED spread metric. I’m hunting up some data on historic yields on closed-end funds. If you have a suggestion, feel free to e-mail me at strategicinsider@aol.com
***Flight From Vanity
Bt the way, as a follow up to last week’s post on how to short the dollar, or “sell” it, I should add that you can use the TED spread to your advantage. The TED spread widens when investors buy Treasuries and sell eurodollar deposits. Treasury buying drives Treasury yields down, while eurodollar selling forces eurodollar yields up. “Buying” the TED spread means playing a widening spread.
You sell the TED spread when you expect yields to tighten. For example, for the week ended September 26th, the discounted yield on the 90-day T-bill was .93. The discounted yield on 90-day eurodollars was 1.07…for a spread of 14 basis points.
From there, you’d compare that with historic spreads, and you’d also take a peak in the futures market and see what the difference is between the cash market and the futures market. If the futures market is acting efficiently, and it senses the spread is out of whack, prices on eurodollar futures will be different than prices on the cash indexes.
However, I don’t want to get too complicated. You COULD use the TED spread, but only when there’s a big divergence between the markets perception of dollars backed by the U.S. government and dollars backed by foreign commercial banks. Right now, the spread is modest. But there might come a day, and not far away, when a dollar backed by a foreign commercial bank is a much better risk than a dollar backed by the U.S. government.
The simple observation is that either on a futures index, you would but and sell eurodollar puts and calls. The last time I recommended it, I recommended euro dollar calls on the basis of what I believed would be lower U.S. interest rates. The futures market had priced in a rate hike, creating a discrepancy. The market was arguing for a wider TED spread. I was calling for a tighter spread.
As you can see, buying options on futures is a little trickier than a straight play on rising interest rates or falling bond prices. For both of those scenarios, go back and look at Friday’s post. And for tomorrow, I’ll pass on the names of a few, gulp, mutual funds, which are even simpler (though costlier) ways to play a rise in U.S. long-term rates.
posted by Daniel @ 9/29/2003 09:06:00 PM
0 comments
![]()

0 Comments:
Post a Comment
<< Home