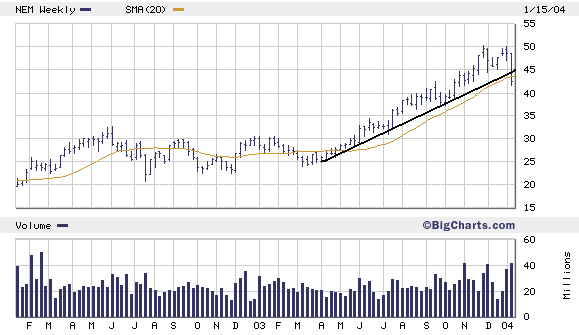
Newmont Weekly Close Chart
Since I looked at Anglogold, I thought I'd take a look at Newmont (NEM) below, too. Note that both charts cover the last two years, with weekly closes, and a 20-week moving average. I built them this way (with the always helpful bigcharts.com) to filter out the daily noise and show you what the more durable underlying trend is right now. You can see that NEM did close under its 20-week MA yesterday. But unless it moves well below that, I'd view now as an opportunity to accumulate more. Spot gold may hold above $400 before making its next big move on the dollars next big move. And gold stocks might move sideways and consolidate their good run. This is the time to buy them, though. Not bail on them.


0 Comments:
Post a Comment
<< Home