January 10, 2004

Save this Link and PDF As Soon as You Can

Distribute this link to as many people as you think would be interested, and quickly. It took me hours to find a link to the actual OFHEO study that was released last year and quashed. It went down Orwell's memory hole. More on the contents of the report next week. http://www.ofheo.gov/Media/Archive/docs/reports/sysrisk.pdf

January 09, 2004

Back to Paris, And The Western World Gets the Bill

I'll be leaving London, back to Paris, in a few hours. So blogging will be light until later this evening...when I hope to send out the weekly e-mail for all Strategic Investment readers. Meanwhile, I've included a few charts, courtesy of the always helpful Japanese Ministry of Finance. A hat tip to my friend Greg Weldon at Macro Strategies for bringing them to my attention. Last night I had a few pints of lager at the George, with Adrian Ash from the Daily Reckoning U.K. and his colleagues Nick Laight and Toby Bray. If you think there's a fixation (financial) with home prices in the U.S. it's even more pronounced here, I'm told. In fact, they tell me that most of the shows before 9pm are all about home and property improvement (for some odd reason, probably related to the BBC, programming on public television before 9pm must be "family friendly.") We also talked about whether, in fact, the Western world is paying the bill for its experiment with extravagant social welfare promises. Perfect topic for a few pints. And then today, I run into these charts from Weldon about...Japan. Ade mentioned last night that the Japanese intervened in the currency markets yesterday to arrest the falling dollar and keep the yen/dollar ratio at or around 106. I did a little digging this morning and found a triennial study from the Bank of International Settlements. That study showed that, as of April 2001, international forex trading reached a daily volume (in $US) of over $1.2 trillion. I imagine, given the monetary looseness of Japan and the Fed (and Fannie and Freddie) that nubmer is even larger now. More money chasing more paper assets. The dollar/yen trade accounted for $230 billion on a daily basis. And so, I ask you dear reader, assuming that number, too, is higher, what difference does $5 billion a day make? We'll see. But central banks have never had much success defending currencies that deserve to be weaker/stronger. Despite intervention, the forex market is huge. And by telegraphing its intentions...the Bank of Japan is making itself into a target the same way the Bank of England did in 1992. In other words, you can't stop a currency from reflecting the underlying strength or weakness of the economy it comes from. Besides, check out the links below to see the size of forex trading on a daily basis, and in particular between certain currency pairs. You'll see that euro/dollar daily volumes were in excess of $350 billion in 2001. If they've grown then, and if Japan can't keep the dollar from getting weaker against the yen when dollar/yen trading is a smaller percentage of total forex volume, who can say if the ECB will have any success talking down the euro, even if it wanted to? Total Forex Volumes forexturnover.bmp Volumes by Currency volumesbycurrency.bmp If you want more background on the dollar/yen exchange rate, make sure to check out this post from December 30th. Even though Japan is in the East, its demographic and fiscal trends are very Western. Maybe this has something to do with the post-war influence of the American occupation. I don't know...it would be an interesting topic to look into. But in any even, the Japanese have precisely the problem that most of Europe has, and that America has too: the government has made promises it cannot keep...and it plans to keep them by issuing debt...and hoping that debt doesn't cause a systemic financial calamity. It's a losing proposition. The only question is how long it will take to bankrupt the State. And in the meantime, huge government borrowing sucks out private investment that might otherwise go toward productive capital investment. It's perversely circular of course. The government borrows the public's savings in order to pay the same public's social security and retirement benefits (among others). In the interim, the cost of the promised benefits get larger and the actual money received by tax payers cheapens in value. Lend dear, cash cheap. Not a good bargain for savers. And of course, the trust cost of such high government borrowing is that capital is grossly, horribly, economy-alteringly MIS-allocated and eventually WASTED. As you can see, this confluence of rising debt and an older population is leading to a giant fiscal boondoggle. The Western Welfare State is on borrowed time. The older they get... Percentage of the population 65 or older The more they cost... Increase in benefits to aging population And the higher taxes and deficits will go Growth in taxes and deficits

Quote of the Day

From the New York Times... "The I.M.F. is right," said C. Fred Bergsten, director of the Institute for International Economics in Washington. "If those twin deficits — of the federal budget and the trade deficit — continue to grow you are increasing the risk of a day of reckoning when things can get pretty nasty."

January 08, 2004

Durable Goods in Log Scale, Chart Realities

Here?s a good e-mail question about yesterday?s durable goods chart. Question: 
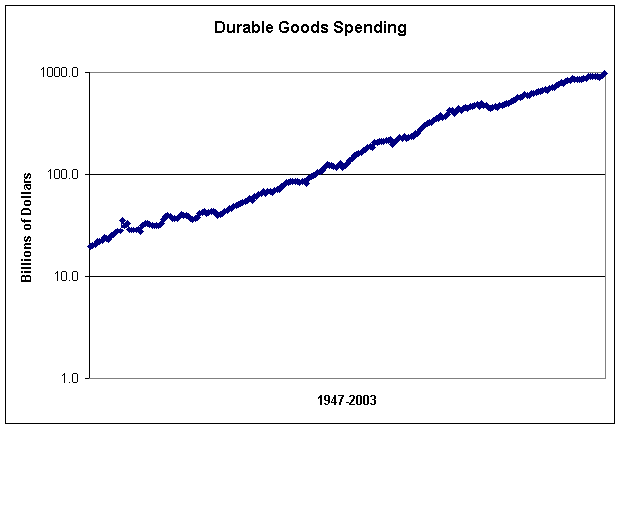
In today's Strategic Insider your consumption chart, PCDG_Max.bmp, goes from 1947 to 2002. You used a linear scale, and consumption appears to be headed for infinity. A long term growth chart needs to be viewed with a log scale.On a log scale it may show realistic normal growth. Can we see it on log scale? Answer: Yes. You can, I think. First, a word on the difference between log and linear. Logarithmic scaling measures changes in value, rather than absolute changes. A log chart will show you a change in percentage terms, while a linear chart shows you just numeric changes. You'd like at a log chart to get a clearer picture of the real change in value in a security. A linear chart, for example, measures vertical difference between 10 and 20 the same as it would measure the difference between 110 and 120, namely 10 units. In percentage terms, of course, the difference between 10 and 20 is a gain of 100%, while the gain between 110 and 120 is only a 9%. Looking at a log chart makes the most sense over time, to give you an idea of the real rate of change in percentage terms. As the alert reader points out, a linear scale shows the y-axis going to the sky. So, assuming I built this Excel chart correctly (and I'm prone to Excel errors now and then), the chart shows a much more gradual pace of consumer spending on durable goods than yesterday's chart. That is, it suggests the pace of consumption grows about the same, I'm assuming, as population and income growth. That's a big assumption, and I'll have to do some more digging. I'd also have to do some more digging to prove what I think the essential point about all this is: even durable goods consumption grows at the same pace as population growth over time, since 1947 that growth has been aided and abetted by installment credit. And while this pace of consumption on credit was sustainable when Americans owed less....average debt levels are now higher. In other words, Americans continue to buy durable goods...along with taking on debt on their homes as well.... Since this log versus linear scale distinction is useful for longer-term numbers, lets take another example, the Nasdaq over the last 10-years. Take a look at the two charts. The top chart is linear scale, the bottom log scale. So what do they show us? Well, first, a bubble is still a bubble. But you CAN see the slight difference in that the big gain between 2,500 and 5,000 on the Nasdaq LOOKS even bigger on the linear chart because, after all, it is a LARGER numeric gain that the gain between 500 and 1,000, or 1,000 and 2,000. In log scale, though, all three gains are 100% gains...and so the slope of the line is more gradual. What's noteworthy about this chart is that even though the log scale shows a more gradual slope...it's STILL a steep slope...indicating unsustainable rate of growth, no matter which way you look at it. P.S. I checked in Excel for the difference in the log formula versus the linear formula. Here?s what the glossary said. Linear: Calculates the least squares fit for a line represented by the following equation: y=mx+b, where m is the slope and b is the intercept Logarithmic:Calculates the least squares fit through points by using the following equation: y= c ln x+b, where c and b are constants, and ln is the natural logarithm function I?m not sure if I got my log chart built correctly. If you're an Excel expert and can do better, you can find the data set at http://research.stlouisfed.org/fred2/series/PCDG/downloaddata

Dow Reaches Up

Check out the Dow chart below, complete with a downward price channel and a line of resistance at 11,000. If the Dow breaches 11,000...will it hold it? And if it cant' hold it, it's a long way back down to the falling price channel of the bear market. Puts would be in order... djia.bmp P.S. sorry that not all the charts are showing up in your web browser. My photo editor only supports bitmap files, not gifs or jpegs...and I suspect that because they're larger files...blogger won't display them, but will link to them. I'll try and fix it up back at the hotel later. Until then, endeavor to persevere.

The Dollar: Europe's Problem Now, The President's Problem at 1.50 to the euro

Below is a great note from Lord Rees-Mogg regarding a dire CBO report about the budget, taxes, and, implicitly, the upcoming U.S. presidental election. I'll be seeing Lord Rees Mogg next week as part of our debut investor's round table here in London. I'll be sure to let you know how it goes... Strategic Insider – 7 January 2004 - William Rees-Mogg In December the Congressional Budget office gave a warning that “unless taxation reaches levels that are unprecedented in the U.S. current spending policies will probably be financially unsustainable over the next 50 years.” Any warning which covers 50 years is likely to be disregarded. Many of us do not expect still to be paying taxes in 50 years time. Those who will are mostly infants or teenagers. And neither infants nor teenagers are regular readers of warnings from the Congressional Budget office. The warning, however, is no joke. What it is really saying, which will be only too familiar to our readers, is that U.S. current expenditures are unsustainable with present levels of taxation. The current Budget deficit is $500 billion. Expenditure will rise. Over the economic cycle the U.S. faces a growing deficit, though the current boom, based on very cheap money, will produce rising tax revenues for the time being, long enough for the Republicans to win re-election in November. Some day, somebody will have to bring spending back into line with taxation or raise taxes to pay for Federal spending. The Federal Budget is politically on the same trend as that of California; it is a disaster waiting to happen, though, unlike California, it is one which can probably be postponed until after the next election. The slide of the dollar is the one aspect of the problem which may force the President, and the Fed. to act. At $1.26 to the euro, it is still possible to argue that the problem is Europe’s rather than America’s. After all, the overvalued euro is the non-competitive currency. It is Europe’s exports which have become too expensive. At $1.50 to the euro, if the market were to reach that point, the problem would very clearly be Washington’s. U.S. monetary policy is very largely determined by the U.S. political cycle, and particularly by the cycle of Presidential elections. It has always been the policy of the Federal Reserve to avoid major policy shifts in an election year. The usual effect is to help the incumbent party. In most Presidential years, the U.S. economy is expanding and stock markets are rising. That is why the Fed. is viewing the present slide of the dollar with such complacency. No-one in Congress, from either party, wants to raise taxes in an election year. However, we are still a long way away from the actual election date. The dollar has already fallen by 30% against the euro and 20% against the pound. At what point will the American public start to notice? Most market analysts expect the slide to continue. At some point, American voters will take the alarm. The slide will have inflationary effects. Both U.S. and foreign producers will start to raise their prices. It is already having some inflationary impact on China, the world’s most competitive producer among the major economies. The Chinese Renminbi is linked to the dollar; that link may have to be broken. The gold price, now over $420 an ounce, will continue to rise. I have been forecasting the rise in the gold price for many months, and I think it has much further to go. At some point, the Fed. will have to react and do something to defend the dollar. The longer the delay, the harder it will be to stop the momentum and reverse it. Yet higher interest rates are very unpopular in an election year, and particularly unpopular with a President seeking re-election. The December warning from the Congressional Budget office is not a 50 year warning. It is more like an 11 month warning. What it is saying is: “Look out for the impact of the Budget deficit on the dollar. It is the one thing that could prevent the re-election of the President.” Now that is a warning that people will notice. Indeed, the President himself will have to notice it. William Rees-Mogg 7 January 2004

VIX Goes Even Lower

Following up on the lead story in the January issue....the VIX is heading lower as the Nasdaq is headed higher. Coincidence? Probably not. vix.bmp If you're studying the "language of the market," as the master Richard Russell likes to say, what would you hear? Well...I like looking at the market's most active stocks. It tells you where investors are looking to make a play. It doesn't show much imagination...except perhaps in the Amex. Nasdaq Most Actives 1) Sirius (SIRI) 233 million shares 2) JDS Uniphase (JDSU) 83 million shares 3) Intel (INTC) 63 million shares 4) Internet Capital Group (ICG) 61 million shares 5) Microsoft (MSFT) 54 million shares Denning Comment: Are you kidding me? Are you completely serious? Internet Capital Group is selling for 41 CENTS A SHARE!! This is the stock Americans are staking their financial recovery on? Granted, an ICG, Commercequest, announced, according to a press release, "its intent to support Linux for IBM eServer zSeries with Process Manager for Data (PM4Data), a component of CommerceQuest's TRAXION Business Process Management Suite (BPMS). " I'm sure that's good news for ICG investors. But is this the kind of business deal that's going to pay for the retirement of millions of American investors? There was no dollar value attached to the new deal...no word of what size revenues it will generate. Will it turn ICGE's $120 loss in the last 12 months into a net gain? Or is the reaction to this deal--and the fact that investors are still pinning their hopes on a tech-led huge recovery in the Nasdaq--just more evidence that this is Tech Bubble Two, same bad dream as last time with same stupid tactical decisions by investors? The question is rhetorical. On the NYSE, Nortel (140 million shares) and Lucent (134 million shares) took the honors for top two most active. The telecom dream is alive and...no better. And in some ways, the nostalgic bullishness in tech is part and parcel of the entire "financial economy." Without Greenspan's liquidity, the chase for a home run tech stock would literally run of fuel. The Amex is about the only interesting exchange in terms of where the market is going (as opposed to where it's been). Three of the top five most active shares were exchange traded funds (PGIs as I call them. The QQQs led with 71 million shares trading hands. SPDRs came in second at 31 million. A stock, Viragen (VRA) came in at 10 million shares. The semiconductor holders that I've traded in Strategic Options Alert (SMH) came in at 10 million. And Harken Energy (HEC) of Bush fame was fifth with a tidy 7 million shares trading hands. A reader wrote asking/disparaging about the idea of using "index funds" to invest in the market, the criticism being that indexing is passive and that you don't invest in the stock market, you invest in stocks...in single ideas rather than the entire market. Point taken. However, that's NOT what I'm recommending with the PGIs I've been recommending. First, if you're bearish, index PGIS (DIA, SPY, OEF, QQQ) ARE an excellent way to take a bearish position ON THE ENTIRE MARKET. But if you're bullish, or if you're trolling different sectors looking for strong bullish or bearish undercurrents, these PGIs are a great way to go. You can think of them as risk aggregators. Instead of taking a lot of individual risks in single stock picking, you can take only one risk in one PGI that trades like a stock...but is leveraged to an entire sector, asset class, or country. For example, the March 04 IEF 85 puts (IEFOG) is a single, simple way to be "short" the U.S. bond market. This particular PGI is a play on the ten-year bond. But it's a proxy for the "big idea" that a weaker dollar is going to drive bond prices down and bond yields up (see the note below from the IMF about the U.S twin deficits causing a sell-off in U.S. assets.) Will it work? We'll see. But the fact that you can even take what I think is a relatively clear cut position so easily, like trading a single stock, is something you simply couldn't do with as much variety, affordability, and speed as you can today. THAT's why I like using PGIs--that and the fact that in a market that's all bubbled up again, looking for value is like trying to find a dry spot on the London pavement on a dreary January day.

The Twin Deficits, Growing Up, Attracting Attention

From Dow Jones Newswires this morning: The White House has said it expects the budget deficit to expand to a record $ 475 billion in fiscal 2004, exceeding 4% of the gross domestic product. U.S. Treasury Secretary John Snow on Wednesday described that level as "entirely manageable," and said the Bush administration expects the deficit to shrink to 2% of GDP within five years. But the IMF researchers said that won't be enough to address the government's long-term fiscal problems - including financing the Social Security (news - web sites) and Medicare programs over the next 75 years. In their report, they said the government faces a $47 trillion shortfall in its ability to pay for those and all other long-term obligations. Closing that gap would require "an immediate and permanent" federal tax increase of 60% or a 50% cut in Social Security and Medicare benefits. The dollar's recent decline, the researchers said, suggests that foreign investors are starting to worry about the U.S. government's ability to resolve its long-term fiscal problems. "The United States is on course to increase its net external liabilities to around 40% of GDP within the next few years - an unprecedented level of external debt for a large industrial country," they said in the report. "This trend is likely to continue to put pressure on the U.S. dollar." The IMF report said the ratio of U.S. public debt to GDP is expected to increase by 15 percentage points over the next decade. If that occurred, global interest rates, adjusted for inflation, would rise by an average of 0.5 to 1 percentage point. "Higher borrowing costs abroad would mean that adverse effects of U.S. fiscal deficits would spill over into global investment and output," the report said.

January 07, 2004

Roof Forming on Homebuilding Stocks

Having worked on this housing report...I've been looking at a lot of charts. The one below is the most interesting. The yellow line is the Amex-listed Willshire REIT index. REITs have been on a tear over the last two years. And they've generally outperformed homebuilders. But as you can see from the blue line (HGX), home-building stocks began outperforming REITS in August of last year. Now...however...HGX is trading smack on the 50-day moving average. And technicians will recognize a tidy double top pattern on the chart.

Haggis and Housing

For those of you waiting for the special report I'm preparing on housing...it is nearly ready to deliver into your hands. Just an FYI. And if you're wondering what the picture below is, it's haggis, the Scottish dish. Best I can gather is that it's a sheep's stomach stuffed with sheep offal or innards, richly flavored, and served as if it were food. I nearly ate some last night at the Scottish Jazz Club/Restaurant I went to dinner at with some colleagues. But, alas, the scallop/haggis special for the day was out. And I didn't even ask what the "offal of the day" was.

"Kucinich Shows Pie Chart on Radio Debate"

Newsday.com does it again.... http://www.newsday.com/news/politics/wire/sns-ap-kucinichs-pie-chart,0,4227061,print.story?coll=sns-ap-politics-headlines

Chart of the Day: Durable Goods Consumption

Every two weeks or so, the Federal Reserve sends out an e-mail updating/changing/manipulating the GDP numbers. And every once in a while, a chart jumps out at you and prompts a few questions. Here's one such chart (for some reason, I can link to it but not display it.) PCDG_Max.bmp The chart shows the dollar amount (in billions) spent by Americans each quarter on durable goods. It starts in 1947 and continues to this very day. Is the chart showing us anything exceptional? For one, it shows us that there was, indeed, a lot of pent up demand for durable goods after World War Two. This probably also had a lot to do with the proliferation of installment credit. And some of the steepness of the curve can be accounted for by both a rising population and falling prices: there were simply more people, and more of them were buying cars and refrigerators, credit or no. Still, it's hard to escape the fact that between 1990 and today, the amount of money Americans have spent on durable goods has doubled. It exceeds a trillion dollars per quarter now, according to the figures. And this in a time where the population has grown, but certainly not doubled. Chalk it up to credit, without a doubt, the Gift of Greenspan. Two questions: 1) How much longer can this go on? (possible answer...with falling prices from cheaper Asian manufactured goods...quite a bit longer.) 2) The bigger question....was America's industrial dominance post WWII an historical aberration...a time when because of the destruction of rest of the industrialized world, America had a monopoly on the production (and consumption) of durable goods. And bonus question, if America's historical competitive advantage in manufacturing durable goods was anomalous...where does that leave us now? If we can't compete based on price for goods...what about services? Will we become a "nation of shopkeepers" as Adam Smith once said of the British, and Napoleon later repeated? Or will we, as one famous economist has said, simply do each other's laundry? What is it America will produce when it stops its consumption binge?

More on Boyd

After the fact, I realized I rather inelegantly described John Boyd's energy manueverability theory for air-to-air fighter combat tactics. It happens. Luckily, Chester Richards (www.belisarius.com) did a much better job in an interesting paper called "A Swift Elusive Sword: What if John Boyd and Sun Tzu did a national defense review." Richard's worked with Boyd well and has applied his theories on strategy as well as anyone. EM theory, according to Richards, shows which, for two competing fighters, "will have the advantage in any flight state (combination of airspeed, altitude, and direction). 'Manueverability' is the ability to change flight states-- to climb, for example, turn, or accelerate, or any combination thereof." You can find more on Boyd at www.belisarius.com. It's an excellent site. Richards has also published a dense but interesting piece Boyd wrote called, appropriately (in the context of a previous post) Destruction and Creation. It's really a theory of knowing and understanding. You can find it here... http://www.belisarius.com/modern_business_strategy/boyd/destruction/destruction_and_creation.htm And, incidentally, I tried to find a version of the Boyd OODA loop that's slightly larger than what I was able to publish in the January issue...but failed. For a link, though, go to http://www.belisarius.com/modern_business_strategy/shay/ooda_loop_sketch.htm

Thrift is Cool...or Soon Will Be

Frightening/enlightening quote of the day: Consumer debt hit a record $1.98 trillion in October 2003, according to the most recent figures from the Federal Reserve. That debt, which includes credit cards and car loans but not mortgages, translates to about $18,700 per U.S. household. You can find the whole article by going to http://www.signonsandiego.com/news/business/20040106-9999_1b6debt.html . Included in the story is a touching anecdote about a woman who relieved her post-traumatic 9/11 stress by...shopping. That's the way to buckle down. Or just buckle, I guess. What really caught my attention in the article is the idea that everyone who remembered what happens when you get too much debt and too much speculation is....dead. Things have been forgotten which investors ought to have remembered. Simple things. Critical things. The things that make the difference between surviving a personal financial calamity...or being utterly ruined. You might call them the lost lessons of responsible finance. There's a whole generation of debt-riddled American's who don't remember an older era where you were more responsible with your money, didn't take the financial future for granted, and planned for the safety of you and your kids (and sometimes the extended family.) The tragic truth is, history shows a disturbing pattern. Just as one generation has forgotten the hard earned lessons of the past....the past repeats itself. It's happened over and over in financial history. And it's happening again. The whole "financial economy" is a bubble barely balanced on the edge of a knife. One tiny slip... Of course those who understand the past are NOT doomed to repeat it. You see, understanding the past gives you a glimpse of the future. Granted, no one can exactly predict WHAT's going to happen, or how it's going to happen. But you can have a pretty good idea. And this gift of foresight, you can stay one, two, even three steps ahead of the average investor. The past really IS prologue. But it doesn't have to be in a negative way. In fact, right now we see a very bright future for investors who are willing to look past the nervous propaganda of Wall Street. The world really IS changing in profound ways. The collapse of America's last and greatest bubble changes the rules of investment. And for those that have the guts to see it now, it's a once in a lifetime opportunity to profit from both the decline of the old order, and the rise of the new one.

Greetings From London, Outpost of the End of the Western World

I'd hoped to have a picture of a proper English breakfast on the Insider today...but the software required to upload pictures from my digital camera TO the computer here in the Fleet Street Publications office...isn't handy. I'll try back at the hotel later. Meanwhile, it's surprisingly nice here in London...nicer than in Paris even, although grayer today than yesterday. I'm here to meet with a few people in "The City." We're forming a sort of investor's round table to exchange ideas and chronicle what I'm calling capitalism's "Journey to the East." The idea--although a bit controversial-- is simple. The world's economic center of gravity is moving...from the socialized welfare states of the West...to the East...to the services capital of the world, India...and the goods capital of the world, China. As I said, "Big Idea." I'll be "unpacking" that idea here on the Insider and in the monthly issues. From a big picture "strategic" perspective, it requires thinking about a world in which America is not the preeminent economy...one where the words "America" and "Capitalism" are not synonymous. It also requires figuring out just what the Asian version of capitalism is going to look like in the 21st century. The "spirit of capitalism" isn't just moving. It's changing...but into what exactly? Tactically speaking...and immediately speaking...one of the immediate causes of this migration of capital and labor from the West to the East is the imminent calamity facing America's financial economy....the economy created, distorted, bloated, and imperiled by artificially low-interest rates. Of course...there can be no creation without destruction. Don't believe me? Just remember the Law of Conservation of Matter...that matter cannot be created or destroyed. It only changes states. (In chemistry terms, strictly speaking, the law states that in a chemical reaction, the sum of the mass of the reactants equals the sum of the mass of the products. ) It's tempting to get into a tangent here about how wealth is created in the context of the law of conservation of matter. That is, it seems to lend itself to a mechanistic description of wealth...that there's only so much that can go around and that all you can do is redistribute it from one place to another. Thus the Marxists. However, human labor, ideas, and ingenuity add value to the raw materials of earth. Matter can be destroyed. But that doesn't mean value can't be added...by turning oil into plastic, steel into skyscrapers, or ebonized birch and walnut into a Steinway. That (adding value to raw materials through ideas) is the spirit of capitalism. And it doesn't have much to do with the kind of financial high-wire act taking place in corporate boardrooms (and private kitchen conversations out of earshot of the kids) all over America. A lot of people won't be comfortable with the idea that America has made an enormous collective moral error by so recklessly pursuing financial wealth instead of producing real value. What is it to be an American if not to live in the citadel of capitalism? Maybe this is what the French feel like right now. DeGaulle is rumored to have once said to Eisenhower that without France, there could be no West. This has turned out, I think, not to be true. Ideas evolve. And though they find better manifestations in some countries and cultures than others...no idea, be it democracy, equality, or capitalism "bleongs" to any one country. These ideas exist, Platonically, whether nations exist. And so there will be capitalism without America leading it. That is the world we're going to live in. That is the great question of the 21st century...what will Asian capitalism look like...and how can investors like you and me profit from it while avoiding the decline and fallout of the deleveraging of America?