Note: I'd planned on posting some additional comments on gold hedging, but I've held off in order to make them more complete. Instead, I've posted here what went out to weekly e-mail readers. Redandant, I know. But in case you're getting your updates here and not at www.strategicinvestment.com, wanted to make sure you didn't miss this.
Last week was a heavy economic research week. And if you’re a new reader, you may be wondering, “well what about the stock market?”
Recent market action confirms what you already know--the financial economy is running out of steam and the stimulus of low-interest rates and tax cuts has lost its potency on the economy--without leading to major new job creation.
But
what, specifically, do I look at to make these conclusions? There are five major indicators I use. I’ve jokingly called them “five signs of the financial apocalypse.” But only half jokingly.
What they DO represent is how close we are to a sudden massive shift away from “financial assets” and into hard assets, or out of the dollar and into gold. When will the femur snap?
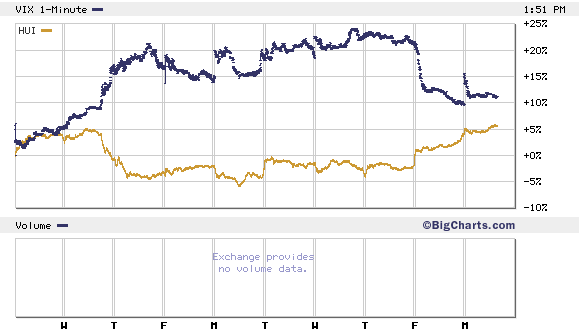
First I look at the Volatility Index (VIX). The VIX is a gauge of investor sentiment, mostly fear. The lower it is, the more complacent investors are. And right now, it’s about as low as it’s ever been. It did creep up a little early last week. But on Friday, the VIX opened at 17.7 and closed at 16. Fear in retreat. Greed on the march. Stocks on the rise.
Below is a ten-day, intraday chart of the VIX and the Philly Gold Bugs Index (HUI). Rising anxiety from investors caused them to even unload gold stocks. But it looks like gold is back in favor--especially with the G7 taking such a spineless stance on the dollar.
 Second I look at investor appetite for speculation. If investors are feeling lucky and bullish, it tends to show up in the put/call ratio available daily from the Chicago Board Options Exchange
. Bullish investors buy calls. Bearish ones buy puts.
Of course, a bullish investor may buy puts to hedge his bets. But generally, the put call ratio is a good measure of speculative sentiment. On Friday, the put call ratio fell to 0.63. If you look closely at the numbers, though, you’ll see that the put call ratio for indexes was 1.72, while the put call ratio for individual equities was 0.46.
I prefer to look at the put/call ratio for individual equities to get a read on what speculators are feeling. The indexes are traded by institutions and firms looking to hedge big bets. And while companies may speculate in their own individual options, the equity put call ratio tells you more about how strongly bullish or bearish individual investors are.
I also prefer this to general surveys about bullish or bearishness because it’s what people are doing with their money, not what they’re saying. It’s one thing to say you’re bullish. Quite another to put your money on the line behind it.
The first two indicators I look at tell you about sentiment and strength of sentiment. The next three tell me more about the overall direction of market and the perception of systemic risk.
What you’re looking for is an indicator that tells you how close the financial system is to a major shift away from financial speculation and toward hard assets. You’re looking for clues that money is moving out of one asset class or sector and into another.
If you don’t believe that we’re in an historic secular bear market, these indicators won’t mean much to you. But if you do, they’ll give you some idea of the level of stress in the system…and whether the levee is going to break. Let me explain…
***OEX and the Financial Economy
When I say financial economy, I mean the S&P 100, or OEX. The OEX is made up of the stocks driving this bear market rally. It’s the most powerful concentration of stocks that gain the most from low interest rates, and have the most to lose when interest rates rise.
First, the OEX has a market cap of $5.7 trillion. That’s 55% of the S&P 500’s market cap of $10.2 trillion. To put that in perspective, it means that
less than 100 companies make up over 50% of the S&P 500’s total capitalization. If you’re looking for a concentration of stock market wealth, this is where you’ll find it.
Second, the two sectors that have most benefited from low interest rates (the lynchpin of the financial economy) make up nearly 40% of the OEX. There are 27 financial stocks and information technology stocks in the S&P 100. They have a combined market cap of $2.27 trillion.
Financial Assets vs. Hard Assets: the Day of Reckoning Approaches
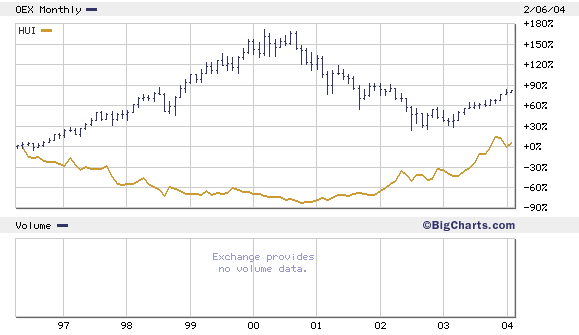 The chart above shows the peroformance of OEX versus HUI since 1996, in log-scale, on a weekly close basis.
The OEX is driven by financial and tech stocks. And the companies on the OEX represent the most actively traded stocks in America, in terms of dollar volume. Keep in mind OEX companies are listed on the three major exchanges, (NYSE, AMEX, and NASDAQ). This truly is a cluster of the most actively traded stocks in America--the ones critical to a new bull market, or an even worse bear market.
On Friday, for example, twenty-one of the twenty-six most heavily traded stocks (in terms of dollar volume) were OEX stocks. And of those twenty-one, eight were financial and tech stocks.
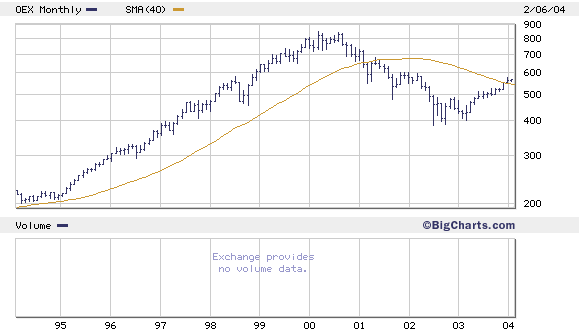
If you’re looking for a broad indicator of where the stock market is headed, you look to the OEX. It’s a pure proxy for the financial economy. Here's the one sentence summary of the chart here:
the OEX began what I think is a new major downward leg in the bear market on January 26th. And if you look around, you’ll see it’s not alone.
***November’s Forecast Comes True
In November, I laid out the case for a “wealth reflation rally” in financial and tech stocks. I was right about the rally but wrong about the time frame. At that time, I used the Wilshire 5,000 (TMWX) and said “If the index pulls off a full 50% retracement of the bear market loss -- it will rise another 11% from its current level.”
I added that, “An 11% rise on the DJIA from the current level of 9,800 would put it about 10,878,” and that “And an 11% rise on the S&P 500 from the 1,046 level would bring us to 1,161.” The rally happened. It took longer than I thought, however. Here’s what we saw, using January 26 closes as “highs”:
Dow predicted level: 10,878. Dow actual level 10,702.
TMWX predicted level: 11,323. TMWX actual level: 11,281
S&P 500 predicted level: 1,161. S&P 500 actual level: 1155.
And so the rally in the financial economy has come, taking all the broad indexes up almost exactly 11% from November levels…and leaving them all at or near a 50% retracement of the total point loss from the top of the market in 2000 to October 2001 lows.
What next?
Nothing notable happened on the 26th that would single it out as the day the second big down leg of the bear began. But stocks did reach some technical achievements that day. And two days later, Greenspan and the Fed issued their infamous “patient” statement.
Maybe the market successfully forecasted the change in interest rate tone. Interest rate policy hasn’t changed, of course. But
for a stock market so rigged to low interest rates, even changing the tone of the discussion may have been enough to convey the message that absent powerful new stimulus, stocks have gained back as much of their bear market loss as they can.
Where will new stimulus come from? From the Fed? It can’t do more than it’s doing. From government spending? Bush and Congress are certainly blowing out all the stops on the budget. But is government spending on defense capital goods or simple income redistribution enough to justify a stock market that’s 10-15% higher from here. I don’t see it.
***Commitment of Traders and the BEDspread
If the OEX tells us what the financial economy is doing, the commitment of traders report and the BEDspread tell us what’s going on behind the scenes.
First, I use the COT report to judge the “smart money’s” interest in gold. If large speculators and commercial gold companies are bullish on the future price of gold in can mean one of two things, or both. First, being bullish on gold might mean a general bull market in commodities (which I happen to think is true right now).
Second, gold bulls are also “financial” bears. The more bullish large speculators are on gold, the more dire the prospects for OEX and the financial economy.
What’s intriguing, as long-time readers know, is the current grudge match between the large gold speculators and the commercials. The commercials continue to be massively short gold, while the speculators are massively long.
My contention, unproven so far, is that
gold companies are “short” gold in the futures market in order to keep the price of spot gold from exploding to the upside. They’re hoping for an “orderly ascent” by gold that won’t force them to deliver hedged gold at prices less that the market value.
This doesn’t amount to a “conspiracy,” I think. Just a business problem. The hedgers hedged too much. And now it could cost them. So they’re massively short in the futures market.
Not everyone agrees with me on this. I asked Jim Rogers in an e-mail what the thought and said simply, “ I don’t buy conspiracy theories about gold.”
Neither do I. But there you have it. And the truth is, as long as the dollar keeps falling, the gold price will rise. I believe there’s a great deal of upward pressure building under gold right now…ready to pop. I’ll keep my eye on the COT report and let you know what it says.
***The BEDspread
And finally, the BEDspread. The flip side of gold bullishness is dollar bearishness. And the ultimate measurement of dollar risk, for me anyway, is the spread between U.S. debt and emerging market debt, as measured by my proprietary BEDspread.
In short, this tells me how close the market is to bailing on the dollar and forcing interest rates up. It’s the difference between the yield on GVT and EMD, two indexes that represent U.S government debt and emerging market debt, respectively.
The BEDspread has been hovering around 4.5 for a month now. Emerging market debt yields went up on sell-offs in the last two weeks, driving the yield on GVT to 9.25%.
Some would describe this as a flight to quality. I would not.
With an annual deficit of $521 billion and a cumulative Federal deficit getting on $7 trillion, the U.S. government is hardly a “quality” borrower.
But for now, the market is content to punish the dollar for the government’s spending sins while sparing the bond market. For now. When the yields start converging, with GVT's rising and EMD's falling, we’ll know a seriously blow has been dealt to the psychological health of the bond market. The dollar pain will begin to have bond consequences.
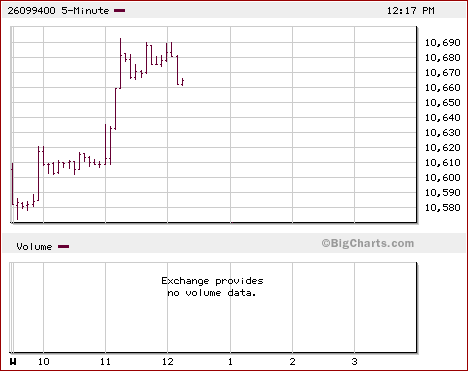
 ...and the Dow
 "
"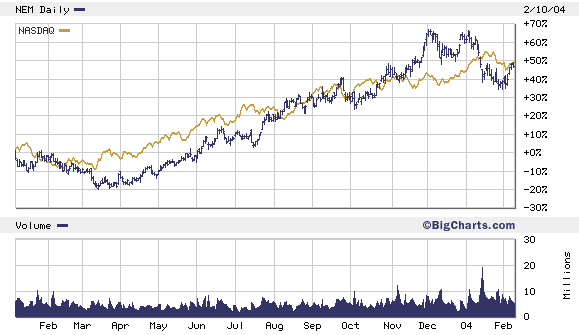 Not so fast, my friend. Let's put our bull (and bear markets) in perspective. Gold is coming off a 20-year bear. It's performance in the last year is the initial stage of what I think is a multi-year bull. Like all stocks, gold stocks can get ahead of earnings. But gold companies are in the business of mining a commodity (and monetary asset) that's increasingly demand. Business is good.
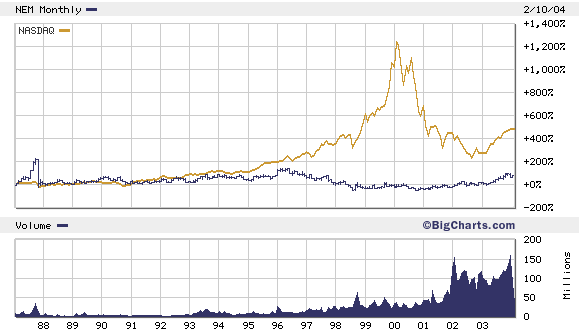
On the other hand, the Nasdaq is the George Foreman of indexes. It's taken some big blows. And though it looks sturdier now than a year ago, it's really just one year older, one year fatter, and one year more bloated. As you can see from the chart below...this is a tale of two bull markets. One that's dead and bouncing...and one that's alive and growing.
Nasdaq vs. Newmont, 1987 to present
 Second I look at investor appetite for speculation. If investors are feeling lucky and bullish, it tends to show up in the put/call ratio available daily from the Chicago Board Options Exchange. Bullish investors buy calls. Bearish ones buy puts.
Of course, a bullish investor may buy puts to hedge his bets. But generally, the put call ratio is a good measure of speculative sentiment. On Friday, the put call ratio fell to 0.63. If you look closely at the numbers, though, you’ll see that the put call ratio for indexes was 1.72, while the put call ratio for individual equities was 0.46.
I prefer to look at the put/call ratio for individual equities to get a read on what speculators are feeling. The indexes are traded by institutions and firms looking to hedge big bets. And while companies may speculate in their own individual options, the equity put call ratio tells you more about how strongly bullish or bearish individual investors are.
I also prefer this to general surveys about bullish or bearishness because it’s what people are doing with their money, not what they’re saying. It’s one thing to say you’re bullish. Quite another to put your money on the line behind it.
The first two indicators I look at tell you about sentiment and strength of sentiment. The next three tell me more about the overall direction of market and the perception of systemic risk.
What you’re looking for is an indicator that tells you how close the financial system is to a major shift away from financial speculation and toward hard assets. You’re looking for clues that money is moving out of one asset class or sector and into another.
If you don’t believe that we’re in an historic secular bear market, these indicators won’t mean much to you. But if you do, they’ll give you some idea of the level of stress in the system…and whether the levee is going to break. Let me explain…
***OEX and the Financial Economy
When I say financial economy, I mean the S&P 100, or OEX. The OEX is made up of the stocks driving this bear market rally. It’s the most powerful concentration of stocks that gain the most from low interest rates, and have the most to lose when interest rates rise.
First, the OEX has a market cap of $5.7 trillion. That’s 55% of the S&P 500’s market cap of $10.2 trillion. To put that in perspective, it means that less than 100 companies make up over 50% of the S&P 500’s total capitalization. If you’re looking for a concentration of stock market wealth, this is where you’ll find it.
Second, the two sectors that have most benefited from low interest rates (the lynchpin of the financial economy) make up nearly 40% of the OEX. There are 27 financial stocks and information technology stocks in the S&P 100. They have a combined market cap of $2.27 trillion.
Financial Assets vs. Hard Assets: the Day of Reckoning Approaches
 The chart above shows the peroformance of OEX versus HUI since 1996, in log-scale, on a weekly close basis.
The OEX is driven by financial and tech stocks. And the companies on the OEX represent the most actively traded stocks in America, in terms of dollar volume. Keep in mind OEX companies are listed on the three major exchanges, (NYSE, AMEX, and NASDAQ). This truly is a cluster of the most actively traded stocks in America--the ones critical to a new bull market, or an even worse bear market.
On Friday, for example, twenty-one of the twenty-six most heavily traded stocks (in terms of dollar volume) were OEX stocks. And of those twenty-one, eight were financial and tech stocks.
If you’re looking for a broad indicator of where the stock market is headed, you look to the OEX. It’s a pure proxy for the financial economy. Here's the one sentence summary of the chart here: the OEX began what I think is a new major downward leg in the bear market on January 26th. And if you look around, you’ll see it’s not alone.
***November’s Forecast Comes True
In November, I laid out the case for a “wealth reflation rally” in financial and tech stocks. I was right about the rally but wrong about the time frame. At that time, I used the Wilshire 5,000 (TMWX) and said “If the index pulls off a full 50% retracement of the bear market loss -- it will rise another 11% from its current level.”
I added that, “An 11% rise on the DJIA from the current level of 9,800 would put it about 10,878,” and that “And an 11% rise on the S&P 500 from the 1,046 level would bring us to 1,161.” The rally happened. It took longer than I thought, however. Here’s what we saw, using January 26 closes as “highs”:
Dow predicted level: 10,878. Dow actual level 10,702.
TMWX predicted level: 11,323. TMWX actual level: 11,281
S&P 500 predicted level: 1,161. S&P 500 actual level: 1155.
And so the rally in the financial economy has come, taking all the broad indexes up almost exactly 11% from November levels…and leaving them all at or near a 50% retracement of the total point loss from the top of the market in 2000 to October 2001 lows.
What next?
Nothing notable happened on the 26th that would single it out as the day the second big down leg of the bear began. But stocks did reach some technical achievements that day. And two days later, Greenspan and the Fed issued their infamous “patient” statement.
Maybe the market successfully forecasted the change in interest rate tone. Interest rate policy hasn’t changed, of course. But for a stock market so rigged to low interest rates, even changing the tone of the discussion may have been enough to convey the message that absent powerful new stimulus, stocks have gained back as much of their bear market loss as they can.
Where will new stimulus come from? From the Fed? It can’t do more than it’s doing. From government spending? Bush and Congress are certainly blowing out all the stops on the budget. But is government spending on defense capital goods or simple income redistribution enough to justify a stock market that’s 10-15% higher from here. I don’t see it.
***Commitment of Traders and the BEDspread
If the OEX tells us what the financial economy is doing, the commitment of traders report and the BEDspread tell us what’s going on behind the scenes.
First, I use the COT report to judge the “smart money’s” interest in gold. If large speculators and commercial gold companies are bullish on the future price of gold in can mean one of two things, or both. First, being bullish on gold might mean a general bull market in commodities (which I happen to think is true right now).
Second, gold bulls are also “financial” bears. The more bullish large speculators are on gold, the more dire the prospects for OEX and the financial economy.
What’s intriguing, as long-time readers know, is the current grudge match between the large gold speculators and the commercials. The commercials continue to be massively short gold, while the speculators are massively long.
My contention, unproven so far, is that gold companies are “short” gold in the futures market in order to keep the price of spot gold from exploding to the upside. They’re hoping for an “orderly ascent” by gold that won’t force them to deliver hedged gold at prices less that the market value.
This doesn’t amount to a “conspiracy,” I think. Just a business problem. The hedgers hedged too much. And now it could cost them. So they’re massively short in the futures market.
Not everyone agrees with me on this. I asked Jim Rogers in an e-mail what the thought and said simply, “ I don’t buy conspiracy theories about gold.”
Neither do I. But there you have it. And the truth is, as long as the dollar keeps falling, the gold price will rise. I believe there’s a great deal of upward pressure building under gold right now…ready to pop. I’ll keep my eye on the COT report and let you know what it says.
***The BEDspread
And finally, the BEDspread. The flip side of gold bullishness is dollar bearishness. And the ultimate measurement of dollar risk, for me anyway, is the spread between U.S. debt and emerging market debt, as measured by my proprietary BEDspread.
In short, this tells me how close the market is to bailing on the dollar and forcing interest rates up. It’s the difference between the yield on GVT and EMD, two indexes that represent U.S government debt and emerging market debt, respectively.
The BEDspread has been hovering around 4.5 for a month now. Emerging market debt yields went up on sell-offs in the last two weeks, driving the yield on GVT to 9.25%.
Some would describe this as a flight to quality. I would not. With an annual deficit of $521 billion and a cumulative Federal deficit getting on $7 trillion, the U.S. government is hardly a “quality” borrower.
But for now, the market is content to punish the dollar for the government’s spending sins while sparing the bond market. For now. When the yields start converging, with GVT's rising and EMD's falling, we’ll know a seriously blow has been dealt to the psychological health of the bond market. The dollar pain will begin to have bond consequences.
